Thursday, May 27, 2010

Unemployment Across America


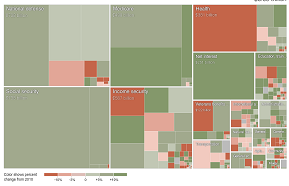
This chart from Slate.com shows the changing picture of unemployment across America by locality. You can see unemployment for a specific month, and by region.

The chart looks good, but performs poorly. It takes a long time to load and can be slow to perform. Still, it makes for an interesting look at how regionalized the jobs and employment picture is across America.

Wednesday, May 26, 2010

Energy Usage and Emissions


This creative chart shows the various sources of waste emissions into the atmosphere, where they came from, and how the energy is being consumed. Follow the arrows to see how agriculture, transportation and changing land usage contribute to pollution.

Source: World Resource Institute

Monday, May 24, 2010

Federal Budget - Where Your Money Goes

Here are two complimentary charts:


2011 Budget Proposal


The first one, from the New York Times, shows Obama’s 2011 Budget Proposal including the ability to see which parts of the budget would increase and decrease. The size of the various squares gives a good perspective of how the Federal government spends money.


YOUR Tax Dollars at Work


The second chart allows you to put in how much you paid in Federal Taxes. It will then show you how your tax dollars are being used. This makes it all a lot more personal than the overall 3+ trillion budget, because it is the money YOU are paying in taxes.

Thanks to the National Priorities Project for this useful tool.

Thursday, May 13, 2010

How Much Water do You Use

This chart shows average water consumption for daily activities. The average person consumes less than 3 gallons a day flushing the toilet, but it takes 33 gallons to make a bottle of soda and 1,500 gallons to make a pound of beef. So go on a soda diet to help the environment.

Colors of the World

This chart shows the proportional colors for each nation's flag. Try looking at each color pie charts and guessing which flag goes with it. Click on a pie chart to see each flag.


At the bottom of the page you can see that red and white make up over 50% of all colors shown on the world's flags.


How People Spend Their Time

This fantastic, interactive chart shows how different groups of people spend their time each day. The New York Times allows you to drill down by activity, age, sex, race, education and parental status.

Mostly what I learned is that the more kids you have, the less sleep you get.

Tuesday, May 11, 2010

Spending by the UK Government


Great chart showing relative size of spending by UK government. Interactive enough that you can zoom in to see details. It also shows the growth or contraction in each area. Compare this to the US budget chart above and let me know which you like more. Source: The Guardian

Public Spending by UK government department

Where does the money go? U.S. Family Expenditures


Interesting chart showing average US consumer spending by family by the Department of Labor. Thanks to Frugal Hacks for the chart.


I like how the average American consumer unit (i.e. family) spends about:
  • 4 times as much on alcohol ($457) as on reading material ($118)
  • Twice as much on apparel ($1,881) as on education ($945)
  • $323 on smoking, and twice as much ($639) on housekeeping